Dashboard
The Dashboard gives you a clear, data-driven view of how much time Twintual is saving you and how many messages the AI has handled on your behalf. It's the proof that Twintual is doing its job — every minute saved is a minute you got back.
What's on this screen
Profile switcher — The pill in the top-right lets you view stats for a specific profile (for example, Personal) or switch to another one to see its numbers in isolation.
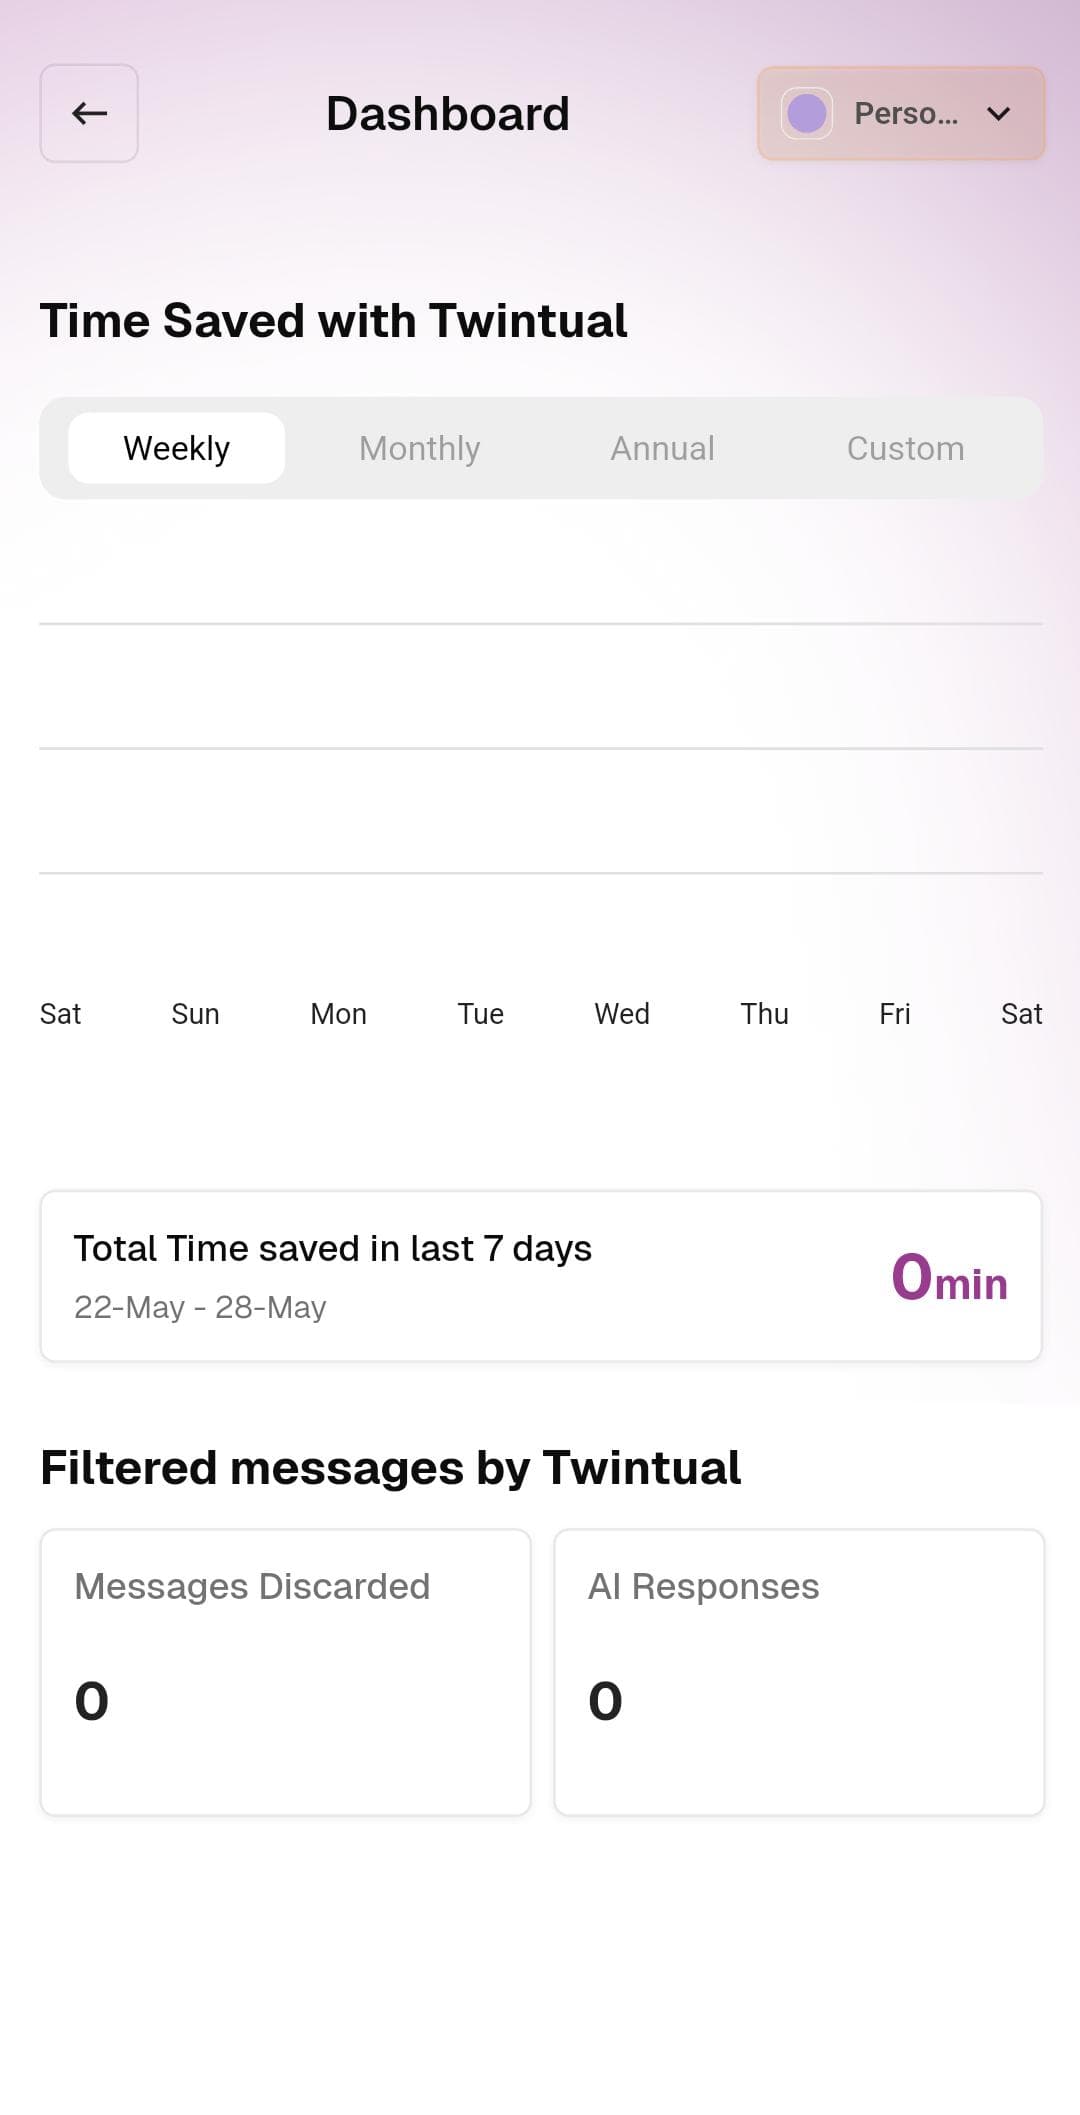
Time Saved with Twintual — The main chart. A bar graph shows minutes saved per day, with four tabs above to change the time range:
- Weekly — last 7 days, day-by-day breakdown
- Monthly — last 30 days
- Annual — full year view
- Custom — pick your own date range
Total summary card — Below the chart, a card summarizes the total time saved in the selected range (for example, Total Time saved in last 7 days · 22-May to 28-May · 0 min).
Filtered messages by Twintual — Two side-by-side cards at the bottom showing:
- Messages Discarded — how many messages Twintual filtered out as noise so you didn't have to see them
- AI Responses — how many replies Twintual drafted for you
What to do
- Tap Weekly / Monthly / Annual / Custom to change the time range
- Tap any bar in the chart to see the specific day's details
- Switch profiles via the pill in the top-right to see per-profile breakdowns
Tips
- Numbers start at zero on day one — give Twintual a week of usage before judging the impact
- The chart updates in real time as Twintual filters messages and drafts replies